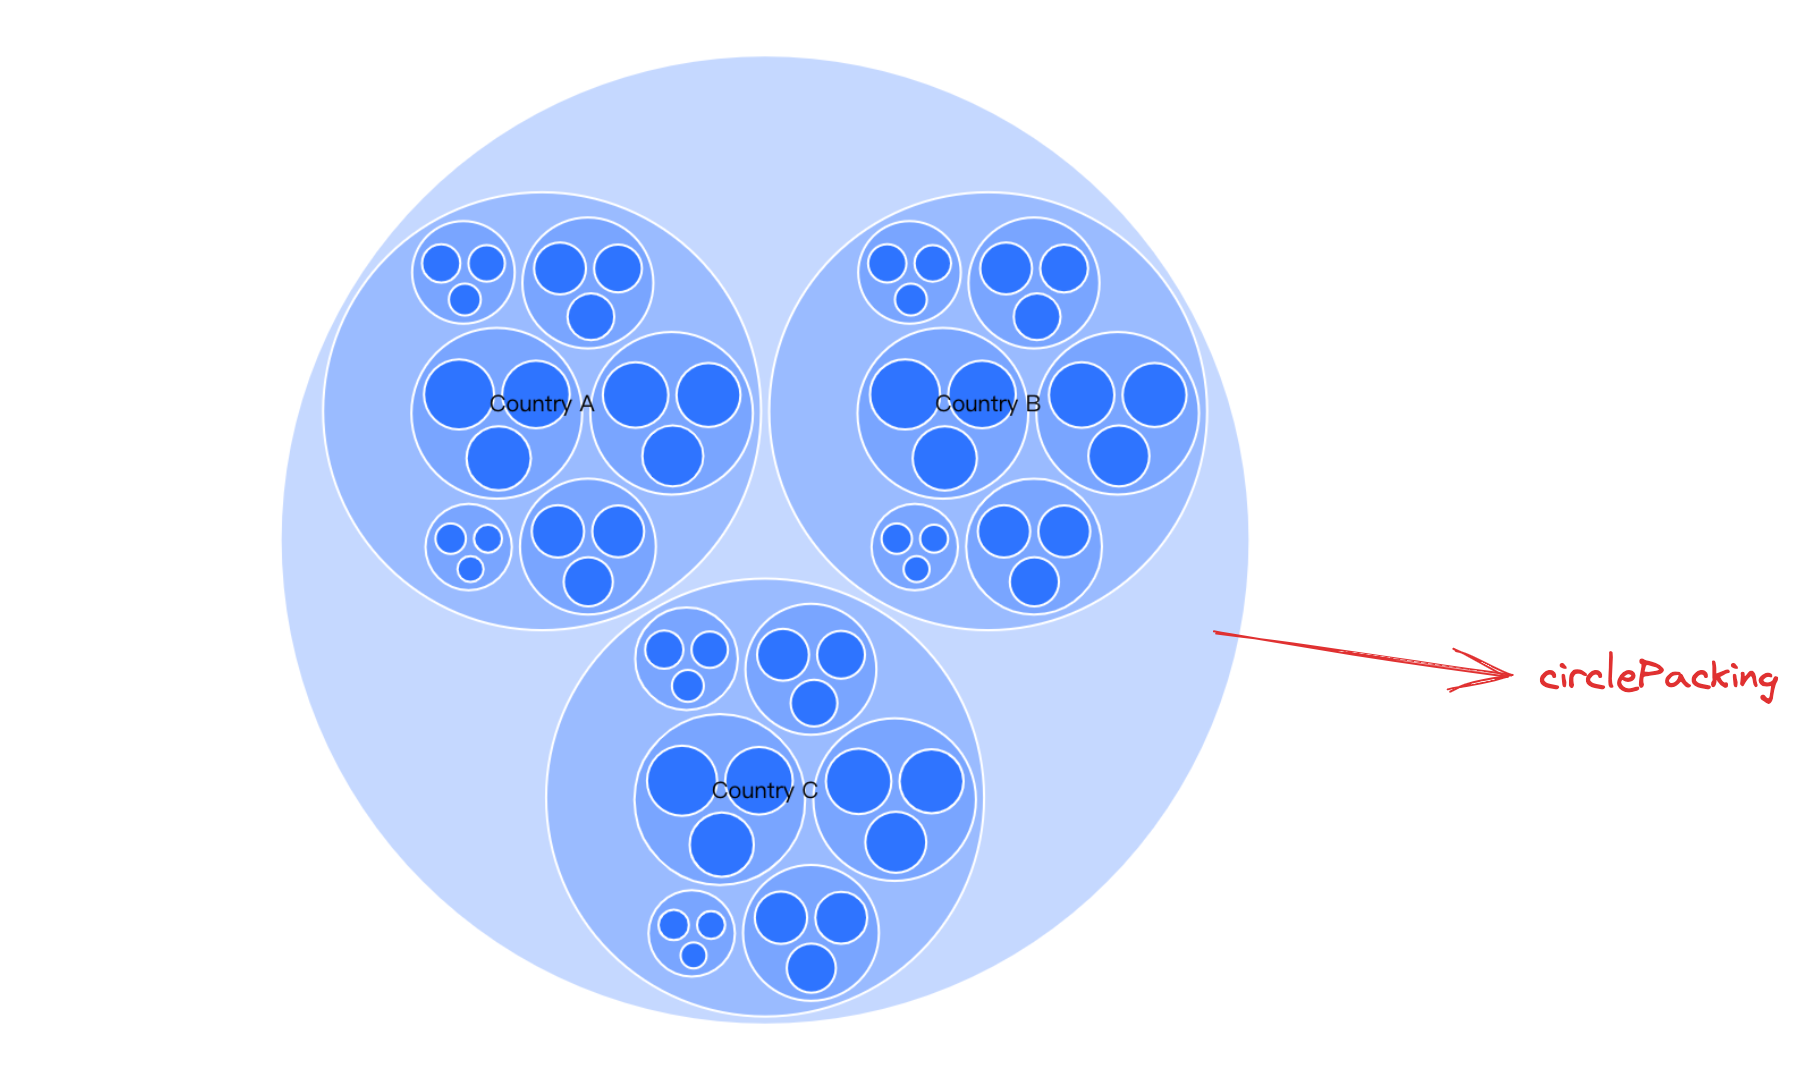
Circle Packing is a circular-based data visualization chart that represents hierarchical data using nested circles. In this type of chart, smaller circles are nested within larger circles, and the size and position of each circle usually reflect the relative values and hierarchical relationships of the data. The properties of the circles, such as size and color, can also be used to provide additional information. Circle Packing charts are commonly used for visual analysis in data mining, ecosystems, and social media analytics, among other fields, but can also be used for other types of data visualization tasks.
Chart Components
Circle Packing mainly comprises nested circle graphics, labels, tooltips, and other elements or components.
Nested circle graphics are the basic elements of Circle Packing, and the related drawing configurations are essential:
circlePackingChart.type: Chart type, the type for Circle Packing is 'circlePacking'
circlePackingChart.data: Data source for chart rendering. In the case of Circle Packing, it is usually a hierarchical structure, like this:
circlePackingChart.categoryField: Category field, mapping different graphics
circlePackingChart.valueField: Value field, mapping the size of the graphics
Tooltips and other auxiliary components for chart display are optional configuration, with default effects and functionality:
circlePackingChart.tooltip: Tooltip, displayed by default when interacting, detailed configuration can be found in VChart Tooltip Component Configuration
categoryField property declaration as classification field
valueField property declaration as a numeric field
circlePacking Circle graphic configuration. By default, all graphics have the same style. To show hierarchical relationships, it is usually necessary to differentiate graphics of different levels through the callback form.
label Label graphic configuration. By default, each graphics object has a label. The leaf node's graphics are smaller, and the corresponding labels will inevitably overlap when displayed, so you need to manually configure the font size and visibility.
Circle Packing Features
Data
As mentioned earlier, Circle Packing expresses nested relationships in the data using nested circles. Thus, the source data must be of a nested structure, such as:
You can control the padding between nested layers by configuring circlePackingChart.layoutPadding Supports passing in an array to separately control the inner padding of a specific layer.
Chart Interactions
Drill Down
The drill-down feature is the ability to click on a parent category to delve into the sub-category information when displaying different levels of sub-data in a rectangular tree chart, Circle Packing, and sunburst chart. With the drill-down feature, users can view details level by level, explore data hierarchy details more deeply, and better understand relationships and differences between data to draw higher-quality analytical conclusions.
By configuring circlePackingChart.drill: true and circlePackingChart.drillField, you can respectively enable the drill-down feature and configure the field on which drilling depends (the drill-down field will use the autogenerated unique key by default, but you need to configure the drillField when using the API for drilling).