A range column chart is a type of bar chart used to represent data changes within a period or a fixed interval. Its main feature is that each bar represents a range rather than a single data point, usually showing the range of data changes on the horizontal axis and the quantity of the interval on the vertical axis. Range column charts are suitable for displaying data that changes over time, such as sales or inventory changes, as well as for showing the distribution of data within a specific time period, such as temperature data or salary distributions.
Chart Composition
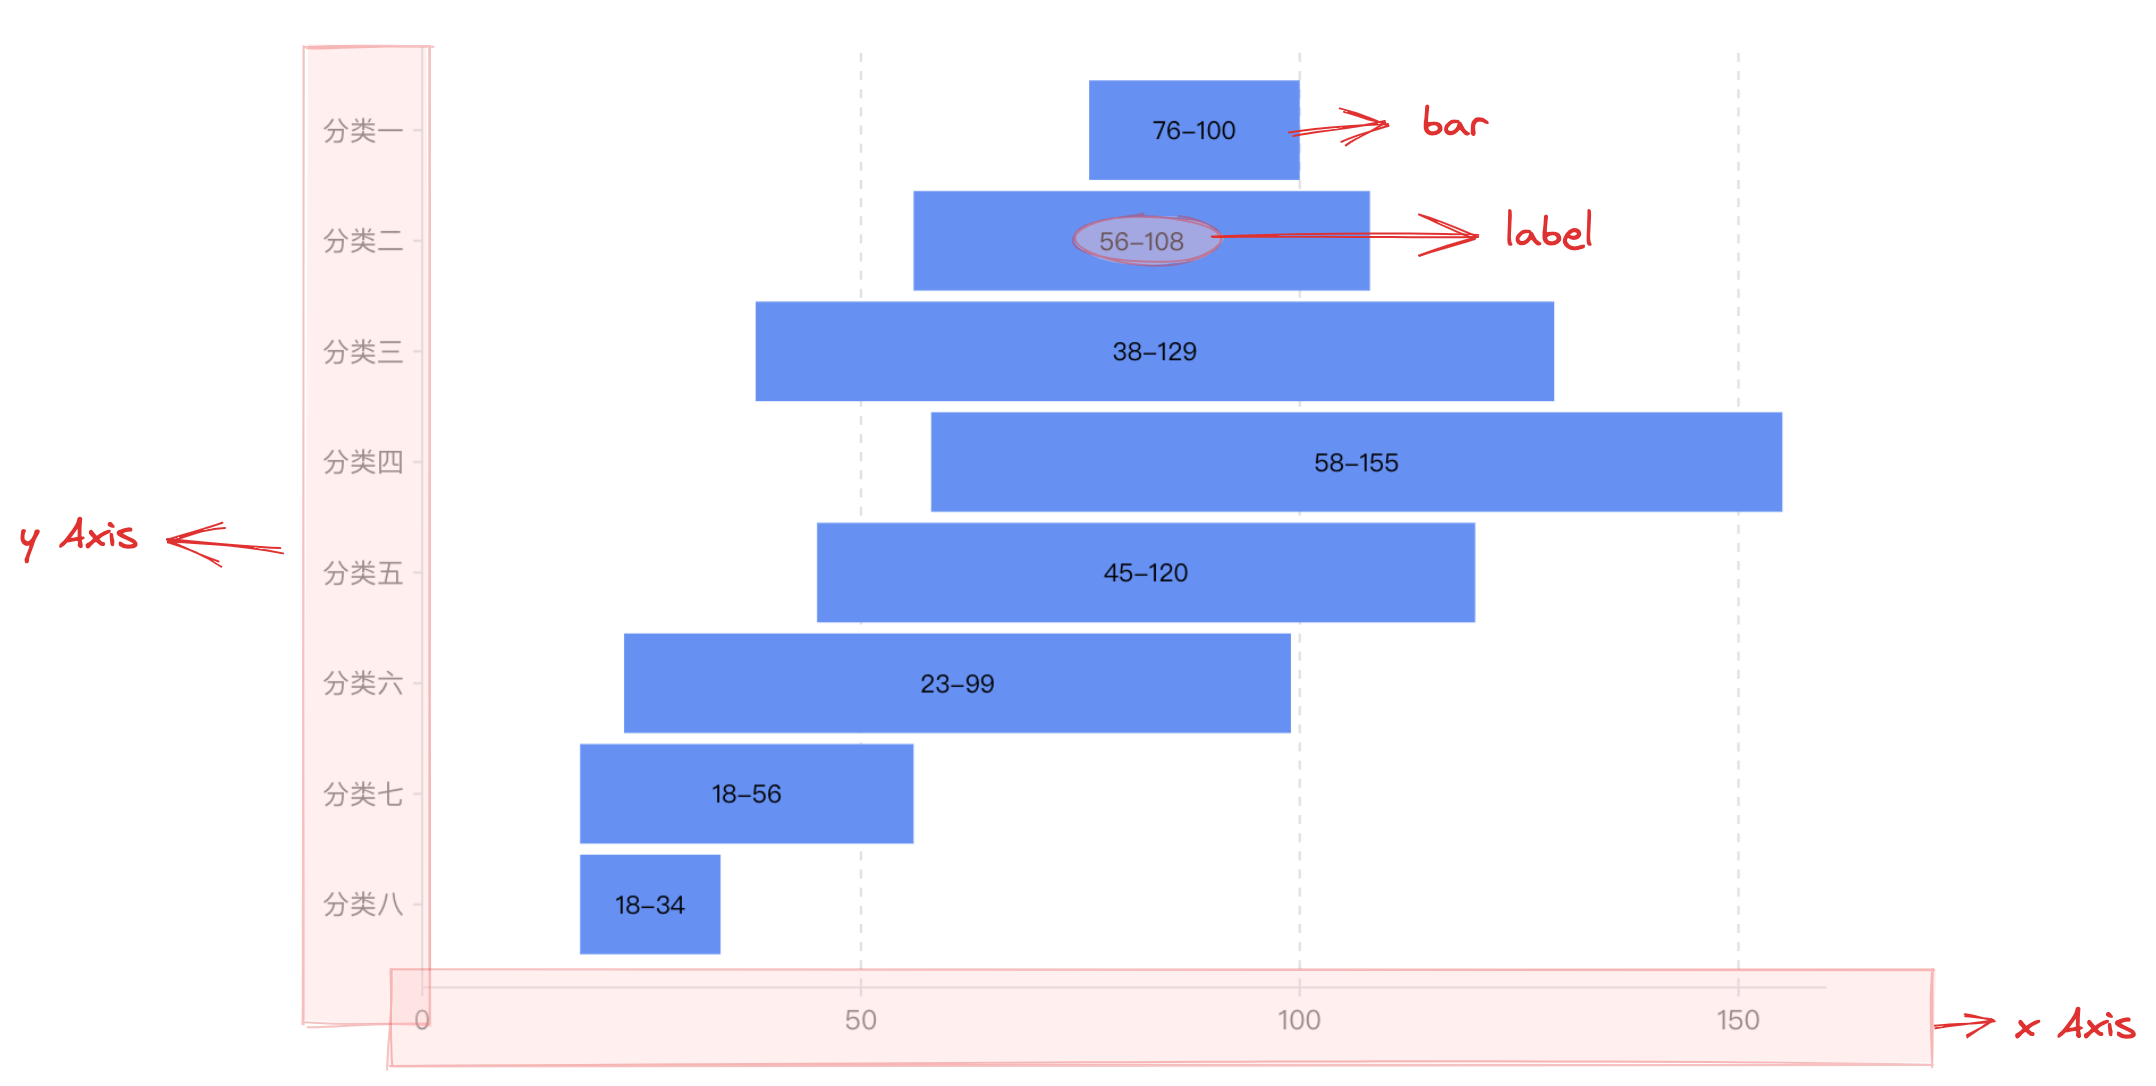
Similar to bar charts, range column charts are composed of rectangular chart elements, axes, and other components.
Rectangular chart elements are essential for range column charts, and related drawing configurations are indispensable:
rangeColumnChart.type: Chart type, the type of column / bar chart is 'rangeColumn'
rangeColumnChart.data: Data source for chart drawing
When rangeColumnChart.direction: vertical
rangeColumnChart.xField: Categorical field, mapping the x-coordinate of the chart element
rangeColumnChart.yField: Array of numeric fields, mapping the lower and upper bounds of the chart element, i.e., representing the minimum and maximum values of the data
When rangeColumnChart.direction: vertical
rangeColumnChart.xField: Array of numeric fields, mapping the left and right boundaries of the chart element, i.e., representing the minimum and maximum values of the data
rangeColumnChart.yField: Categorical field, mapping the y-coordinate of the chart element
Axes, tooltips, and other components that assist in chart display are optional configurations with default effects and features:
rangeColumnChart.axes: Axis component, the default display automatically infers the coordinate system and data mapping logic according to the chart type, detailed configuration can be found in VChart Axis Component Configuration
The overall configuration of range column charts is similar to that of bar charts, but since each bar represents a range of values, labels are usually needed for information assistance. In VChart, there are four label layout types for range column charts: rangeColumnChart.label.position: 'middle' | 'start' | 'end' | 'bothEnd', which represent labels placed in the middle, at the start point, at the end point, and at both ends, with the default being 'middle'.