Heatmap in Cartesian coordinate system requires the x-axis and y-axis to be discrete axes. It has an additional valueField in the configuration compared to bar charts, which is used to specify the weight at a certain discrete coordinate.
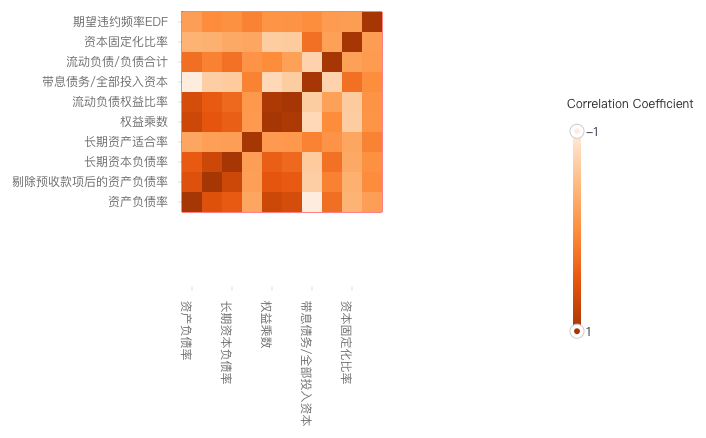
One common example is to use a heatmap to represent the correlation between different statistical variables. By looking at the colors of different squares on the heatmap corresponding to the size of correlation coefficients, we can determine the size of the correlation between different variables.
In VChart, you can use the Heatmap Configuration to display the correlation between different variables. As shown in the following figure, this example shows the data of listed companies in 2016 by exploring the correlation between various indicators of listed companies through heatmap:
In the Heatmap Example shown above, you need the following key configurations:
Set xField attribute as the x-axis classification field
Set yField attribute as the y-axis classification field
valueField numeric field
Chart Components
Heatmap consists of rectangle elements, axes, legends, and other components.
Rectangle elements are the basic elements of the heatmap, and related drawing configurations are essential:
heatmapChart.type: Chart type, the type of heatmap is 'heatmap'
heatmapChart.data: Data source for chart drawing
heatmapChart.xField: x-axis classification field, mapping element x coordinate
heatmapChart.yField: y-axis classification field, mapping element y coordinate
heatmapChart.valueField: Numeric field, indicating weight. By configuring the visual channel, it can be mapped to specific attributes of the element. The following code example shows how to map the weight to the color of the rectangle element:
{
  color: {
    type: 'linear', // Linear mapping
    domain: [
      {
        dataId: 'data0', // Dataset name
        fields: ['value'] // Corresponding weight field name
      }
    ],
    range: ['#feedde', '#fdbe85', '#fd8d3c', '#e6550d', '#a63603'] // Mapping result
  }
}
Axis, legend, and other components are optional configurations that support default effects and functions:
heatmapChart.axes: Axes components, default display and automatically inferred coordinate system and data mapping logic according to chart type, detailed configuration can be found in VChart Axes Component Configuration
heatmapChart.legends: Legend components, linear legends are commonly used in heatmaps to display mapping relationships, detailed configuration can be found in VChart Legend Component Configuration