VSeed, an elegant data composer, transforming complexity into simplicity.
!!!###!!!title=Getting Started with Data Video——VisActor/VChart tutorial documents!!!###!!!!!!###!!!description=Data video is a form of video that displays and introduces data content through diagrams, animations, annotations, narrations, etc. It can not only make complex data more understandable, but also guide the audience to obtain useful information and insights from it. Data video is usually used for commercial display, coverage, education and training, etc. It is a very effective way of presenting data and is popular on major short video platforms. Through data video, abstract data can be transformed into intuitive graphic display, which can be displayed in a more interesting form, making it easier for the audience to understand and accept. Data video can allow the audience to understand the story behind the data more deeply, improve the audience's understanding and trust of the information, thereby increasing influence and persuasion.The production process of data video includes:1. Identify Data Sources and Themes2. Collect and organize data3. Charting, editing and exporting4. Video editingTraditional data video making processes require creators to use professional visualization software to draw data as graphs after collecting data; or use various chart libraries to draw graphs through coding and export them as videos. In the era of short videos, everyone can be the creator of videos. However, non-professional video creators often do not have the ability to visualize data lake as graphs and export them as videos, which greatly raises the threshold for making data videos.@VisActor/VChart provides a full-process solution from data to presentation, with "visual narrative" and "intelligence" as its core competitiveness. The powerful generation ability of large language models provides VChart with a natural language interactive interface, allowing us to directly call VChart's capabilities through natural language, and complete chart generation and editing with simple, fast and high quality.@VisActor/VMind is a chart intelligence module based on VChart's large language model, providing intelligent chart generation, intelligent color scheme, conversational chart editing and other capabilities. Using VMind to create data videos, users only need to collect the data and describe the content they want to display in one sentence, then they can directly generate chart animations, and support one-click export as videos and GIFs, which greatly reduces the threshold for creating data videos.Next, we'll show the complete process of making a chart video with VMind!!!###!!!
Getting Started with VMind Data Video
Data video is a form of video that displays and introduces data content through diagrams, animations, annotations, narrations, etc. It can not only make complex data more understandable, but also guide the audience to obtain useful information and insights from it. Data video is usually used for commercial display, coverage, education and training, etc. It is a very effective way of presenting data and is popular on major short video platforms. Through data video, abstract data can be transformed into intuitive graphic display, which can be displayed in a more interesting form, making it easier for the audience to understand and accept. Data video can allow the audience to understand the story behind the data more deeply, improve the audience's understanding and trust of the information, thereby increasing influence and persuasion.
The production process of data video includes:
Identify Data Sources and Themes
Collect and organize data
Charting, editing and exporting
Video editing
Traditional data video making processes require creators to use professional visualization software to draw data as graphs after collecting data; or use various chart libraries to draw graphs through coding and export them as videos. In the era of short videos, everyone can be the creator of videos. However, non-professional video creators often do not have the ability to visualize data lake as graphs and export them as videos, which greatly raises the threshold for making data videos.
@VisActor/VChart provides a full-process solution from data to presentation, with "visual narrative" and "intelligence" as its core competitiveness. The powerful generation ability of large language models provides VChart with a natural language interactive interface, allowing us to directly call VChart's capabilities through natural language, and complete chart generation and editing with simple, fast and high quality.
@VisActor/VMind is a chart intelligence module based on VChart's large language model, providing intelligent chart generation, intelligent color scheme, conversational chart editing and other capabilities. Using VMind to create data videos, users only need to collect the data and describe the content they want to display in one sentence, then they can directly generate chart animations, and support one-click export as videos and GIFs, which greatly reduces the threshold for creating data videos.
Next, we'll show the complete process of making a chart video with VMind
Data preparation
First, you need to identify the data source and Theme. Data can come from various sources, such as public data platforms, market research, internal company data, etc. Theme can be any data-related topic, such as sales data analytics, social phenomenon analysis, industry trends, etc.
Here we collect data on domestic car sales from the Internet as what we want to present, including time, car manufacturers, and sales. Here we only show some data:
Time
Automakers
Sales
April 2023
BYD
183534
April 2023
SAIC Volkswagen
96203
April 2023
FAW-Volkswagen
78011
April 2023
GAC Toyota
76925
April 2023
Changan Automobile
76455
April 2023
FAW Toyota
71383
April 2023
GAC Honda
60462
April 2023
Geely Auto
59661
April 2023
SAIC-GM-Wuling
58210
April 2023
BMW Brilliance
53205
May 2023
BYD
209730
May 2023
SAIC Volkswagen
90193
May 2023
FAW-Volkswagen
83610
May 2023
Changan Automobile
81209
May 2023
GAC Toyota
77513
May 2023
FAW Toyota
70001
May 2023
Geely Auto
67100
May 2023
SAIC-GM-Wuling
63292
May 2023
Dongfeng Nissan
56511
May 2023
FAW-Volkswagen Audi
52696
June 2023
BYD
220600
June 2023
FAW-Volkswagen
98052
June 2023
SAIC Volkswagen
94018
June 2023
GAC Toyota
86345
June 2023
Changan Automobile
86189
June 2023
Tesla China
74212
June 2023
Geely Auto
71726
June 2023
FAW Toyota
70795
June 2023
GAC Honda
65540
June 2023
FAW-Volkswagen Audi
64037
We want to tell the competition landscape of the domestic auto market by showing the changes in the sales rankings of domestic auto brands.
Chart generation
After collecting the data and clarifying the video theme, we can use VMind to quickly generate chart videos.
First, we need to install VMind in the project:
    # using npm
    npm install @visactor/vmind

    # using yarn
    yarn add @visactor/vmind
Next, use at the top of the JavaScript file import Introducing VMind
import VMind from'@visactor/vmind';
We can then use VMind in our projects. VMind currently only supports OpenAI GPT-3.5 models, you need to provide OpenAI API key Can be used. In the future we will support more large models and allow users to customize the method of calling large models.
First, we organize the data into csv format, which can be done with the help of tools such as Excel:
Next, we initialize a VMind instance and pass in the OpenAI Key:
const vmind = new VMind(openAIKey); //Your OpenAI key as parameter
The content we want to show is "Changes in the sales ranking of each brand of cars". Call the generateChart method to pass the data and display content description directly to VMind. VMind currently also supports specifying video duration and color scheme styles. The relevant code is as follows:
const describe =
  'display the changes in sales rankings of various car brands, with a duration of 20 seconds and a futuristic style.';
const { spec, time } = await(vmind.generateChart(csvData, describe)); //Intelligent chart generation, input your data and chart description in csv format, and return the chart spec and animation duration.
In this way we get the VChart spec and video duration corresponding to the dynamic chart.
VMind currently supports bar charts, pie charts, line charts, scatter charts, word clouds, and dynamic bar charts. you can refer to Get started quickly with VChart. Use VChart to plot it, or continue to use VMind to export it as a video or GIF. In the future, VMind will also support conversational chart editing, applying editing operations directly to charts through natural language for more personalized data video creation.
Chart video export
Export the generated chart as a GIF or video using the following code:
//export as videoconst videoSrc = await vmind.exportVideo(spec, time); //passing in the chart spec and video duration, return ObjectURL//export as GIFconst gifSrc = await vmind.exportGIF(spec, time); //passing in the chart spec and gif duration, return ObjectURL//create DOM element for downloading filesconst a = document.createElement('a');
a.href = videoSrc;
a.download = `${filename}.mp4`; //set the name of the filea.dispatchEvent(new MouseEvent('click')); //save to local
The final exported video is as follows:
You can import the exported video or GIF into the video editing software and continue to complete the production of the data video.
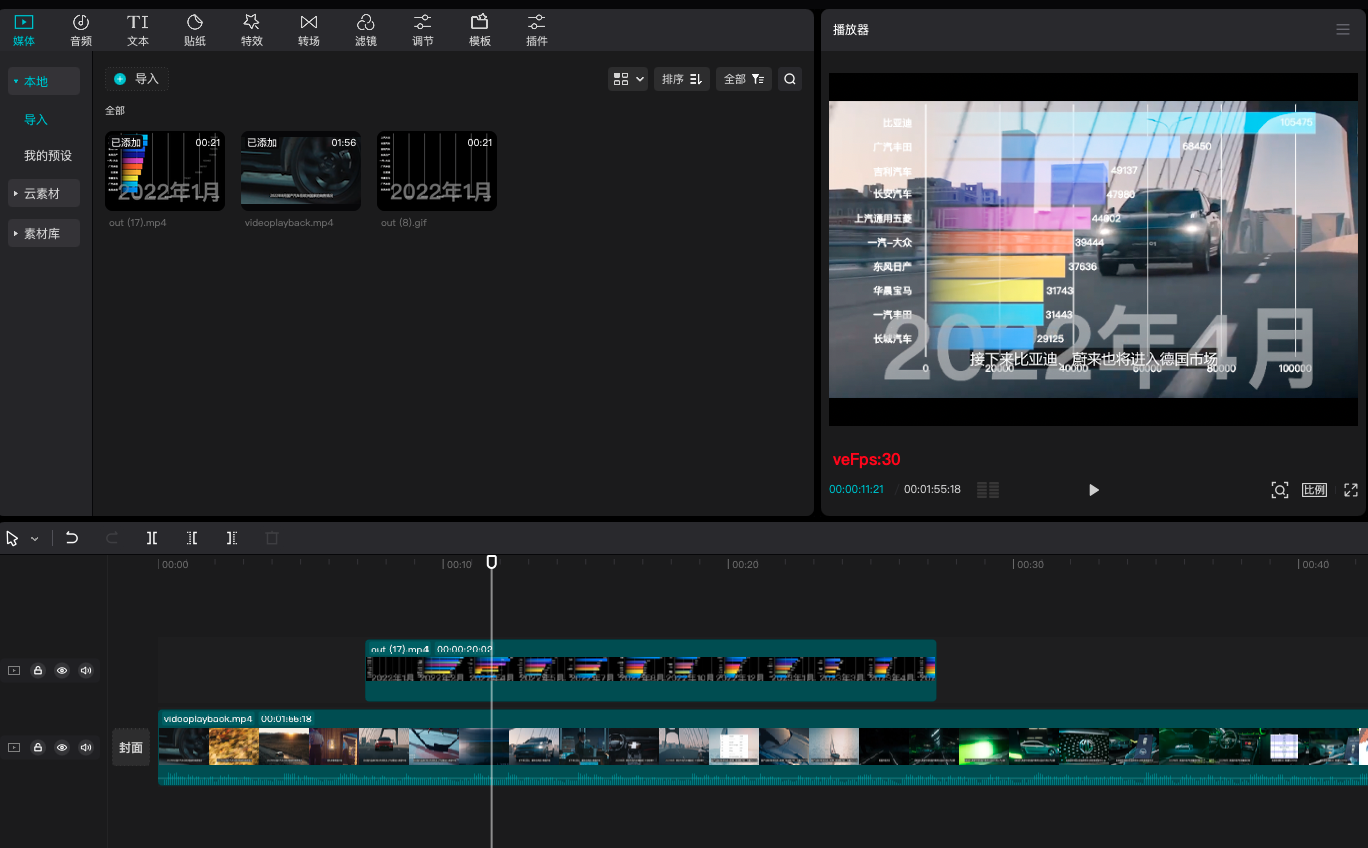
Edit video
We can import the data video generated by VMind into video generators such as Jianying, Pr, Final Cut, etc., and add subtitles, background music, sound effects, transitions, etc., to make the video more vivid and interesting:
In the end we got the following data video clip:
You can post it on various short video platforms such as Tiktok, or insert it into PPT for presentation, reporting, and other purposes, to let more people know about your ideas.
summarize
This tutorial shows the complete process of using VMind to make data videos, including data preparation, chart generation, chart video export, and editing videos. VMind currently supports bar charts, pie charts, line charts, scatter charts, word clouds, and dynamic bar charts to meet the narrative needs of users. VMind is able to recommend suitable chart types based on user data and exhibition diagrams, and map data fields to suitable visual channels, automatically generate color palettes that meet user requests, helping you easily complete data narratives. In the future, VMind will continue to support more chart types (radar charts, sankey charts, waterfall charts, etc.), and add conversational chart editing functions to further reduce the creation threshold of data videos.